Agent Loop Observability With OpenTelemetry Tracing
Catch silent agent failures with structured tracing and semantic conventions.
Agent loops fail silently. That's the core problem this piece is about: a system built on OpenTelemetry can turn every LLM call, every tool invocation, every memory lookup inside an agent's execution into a connected, inspectable span, which is the only way to catch failures that traditional monitoring is structurally blind to. Application performance monitoring was built for code that behaves the same way twice. Feeding it the same input gives you the same output, so a spike in latency or a jump in error rate tells you something real broke. Agents don't work that way. An agent can call the wrong tool, loop past where it should have stopped, or hallucinate an entire answer, and still hand back a clean 200 response inside normal latency bounds. The dashboard stays green while the output quietly goes wrong.
The clearest illustration of this gap comes from a production case where an agent was telling customers their orders had shipped when they hadn't, affecting somewhere around 3 to 4 percent of conversations, scattered unevenly across timezones so the pattern didn't jump out in aggregate. Error rate: zero. Latency: nominal. Every health check the team had: green. The root cause turned out to be a tool execution silently returning cached data from a stale connection pool, and it took hours of grepping through unstructured logs to find it, because APM had no instrumentation surface built to catch this kind of failure, and the logs had no causal chain linking the bad tool output to the bad customer-facing claim. That's the gap OpenTelemetry's GenAI work is trying to close.
How the OpenTelemetry GenAI semantic conventions came to exist and where they stand now
Before any of this was standardized, every observability vendor built its own schema for LLM telemetry, which meant a trace captured in one backend didn't mean anything in another. OpenTelemetry answered that in April 2024 by forming the GenAI Special Interest Group under its Semantic Conventions SIG. The original scope was narrow: tracing calls to LLM clients, largely modeled on how HTTP client calls already got traced.
The scope didn't stay narrow for long. It has since grown to cover agent orchestration, tool calling through a standardized protocol for connecting tools, content capture, and quality evaluation, six layers in total. Adoption has grown steadily through 2026, though the conventions remain pre-stable, and vendors are still catching up to the latest shape of the spec.
On June 12, 2026, with the release of v1.42.0, the conventions moved out of the core semantic conventions repository entirely, into a dedicated repo called semantic-conventions-genai. The MCP conventions moved with them. The reasoning is straightforward: this corner of the spec needs to iterate faster than the stability bar the core conventions hold themselves to, and keeping it separate lets that happen without breaking things elsewhere. The old opentelemetry.io/docs/specs/semconv/gen-ai/ pages are now stub pages with inline "moved" notices, not HTTP redirects, so bookmarks and old blog links will land on a dead end rather than forwarding automatically.
The gen_ai.* attribute vocabulary: what each span carries
Every span in this system is built from a set of gen_ai.* attributes, and learning the vocabulary comes before arguing about how to use it. gen_ai.system identifies the LLM provider, openai, anthropic, google_vertex_ai, and so on. gen_ai.operation.name captures what kind of operation happened, chat, text_completion, embeddings, or, for agent-specific steps, things like invoke_agent, plan, and execute_tool. gen_ai.request.model and gen_ai.response.model are tracked separately on purpose: the model you asked for and the model that actually answered can differ due to routing, fallback, or provider-side substitution.
Request parameters get their own attributes too: gen_ai.request.temperature, gen_ai.request.max_tokens. Token counts are in gen_ai.usage.input_tokens and gen_ai.usage.output_tokens, which is the cost and latency signal that ordinary APM has no concept of. And gen_ai.response.finish_reasons gen_ai.response.finish_reasons might be the single most diagnostic field in the whole set: it tells you the model stopped because it decided it was done (stop) or because it triggered another action (tool_calls). An agent that finished its job and one that's about to go around the loop again are often separated by that split.
A second cluster of attributes identifies the agent itself: gen_ai.agent.id, gen_ai.agent.name, gen_ai.agent.version. gen_ai.conversation.id acts as the correlation key that ties a multi-turn exchange together across separate calls, which matters enormously once you're trying to reconstruct a session after the fact rather than watching it live. gen_ai.provider.name discriminates between the specific telemetry format flavors different providers emit, since not every vendor structures its GenAI data identically even under the same umbrella spec.
Content capture is where the design gets deliberate rather than incidental. Storing the full text of a prompt directly as a span attribute is an anti-pattern, and for good reason: attributes are indexed by default, they carry size limits, and dumping raw prompt text into them is a fast way to leak PII straight into your observability backend. The GenAI conventions instead push content into span events, which can be filtered or dropped entirely at the Collector level without touching a single line of application code. The named events follow the natural order of a call: gen_ai.system.message and gen_ai.user.message fire before the LLM call, gen_ai.assistant.message and gen_ai.tool.message after. And critically, content capture is opt-in. Nobody gets full conversation text logged by accident just because they installed the instrumentation.
The span hierarchy that represents an agent loop execution
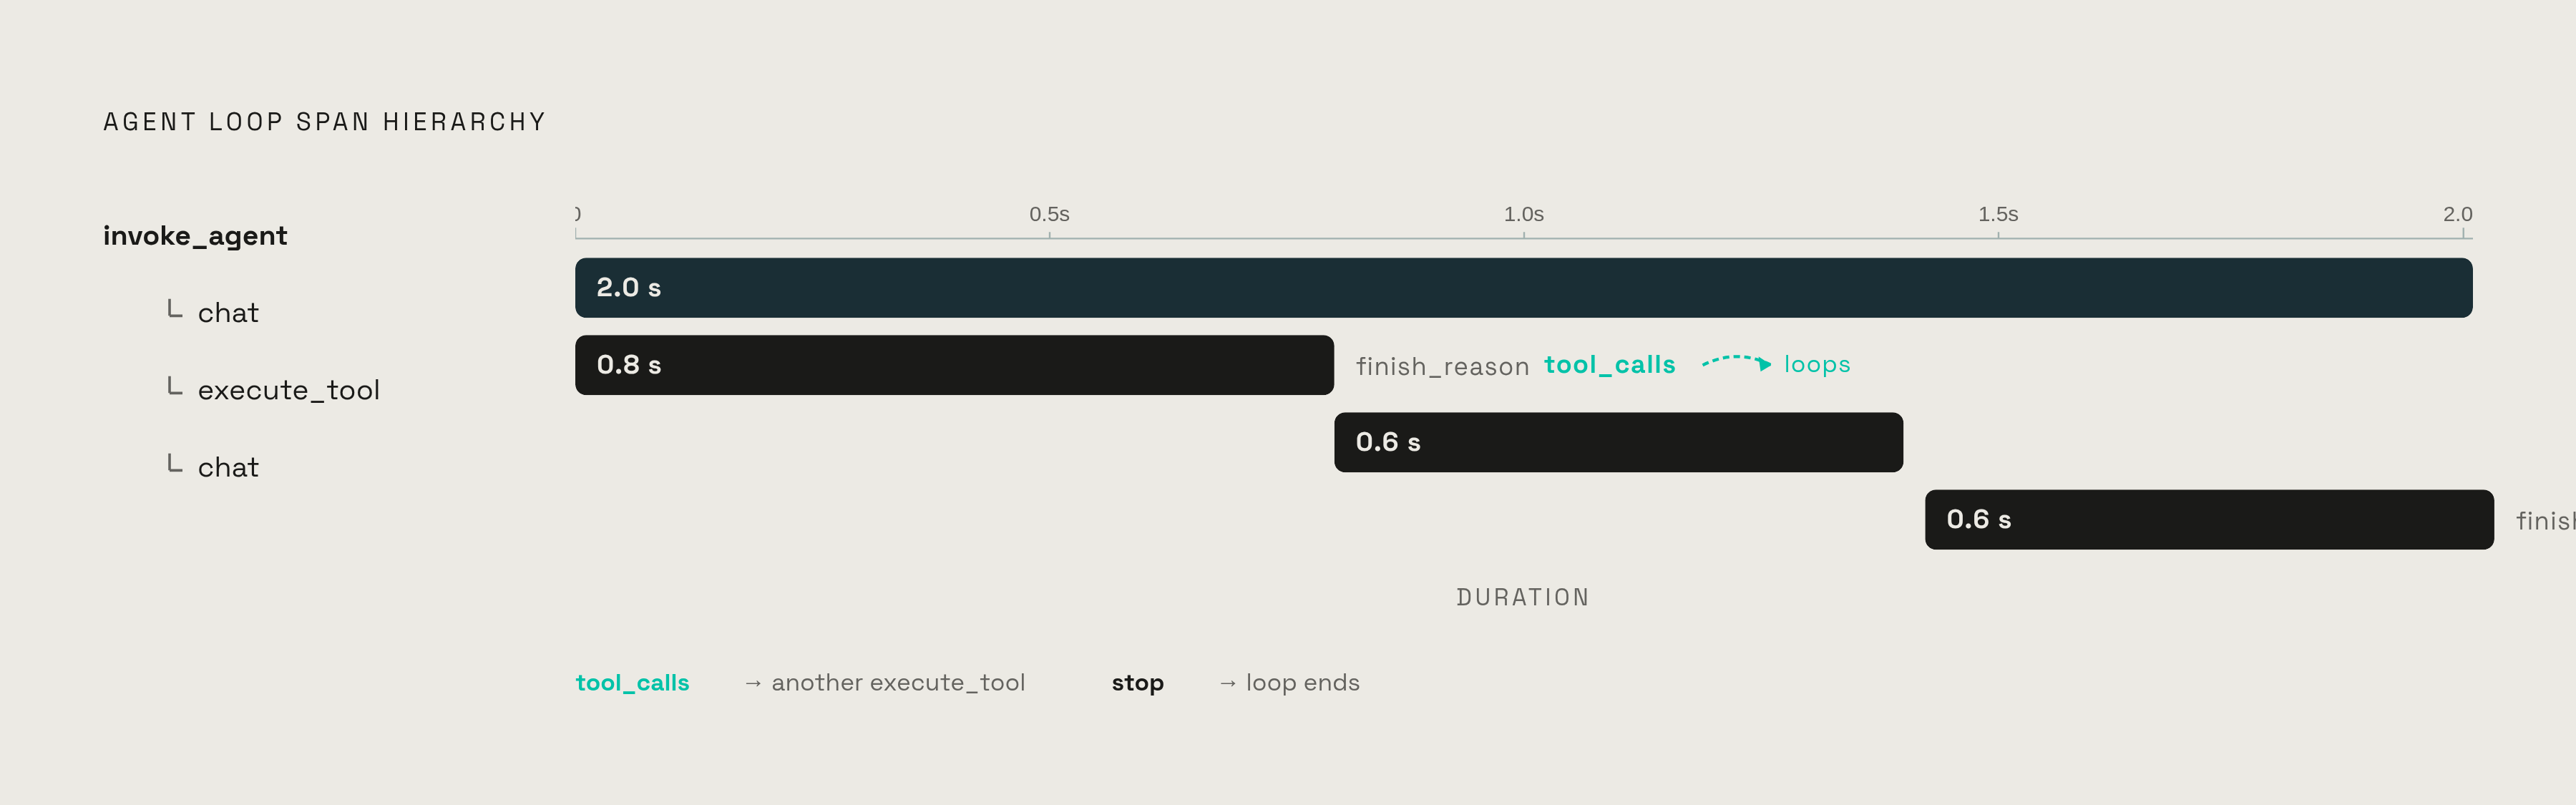
The entire agent loop is the root span, and every LLM call and every tool execution nests underneath it as a child span; this simple structural model is powerful in practice. That hierarchy is what turns a black box into something you can read at a glance, total duration for the whole agent run, how many steps it took to get there, and exactly where the time actually went.
A trace built this way shows a top-level invoke_agent span sitting above child chat spans for each LLM call and execute_tool spans for each tool invocation the agent made along the way. Select the trace and the whole shape of the execution is right there in the span tree.
What should live inside each of those spans is fairly well defined at this point. Span type comes first: tool call, reasoning step, state transition, or memory operation. Inputs matter, structured arguments, the query that was issued, or whatever prior state fed into the step. Outputs matter just as much: the raw return value, retrieved records, or the new state the step produced. Timing gets recorded as start, end, and duration. Errors and retries need typed error state, a retry count, and the parent retry context so a failure can be traced back to what triggered it. And every span carries identifiers, trace ID, parent span ID, session ID, and user or tenant ID, so a single step can always be located inside the larger run it belongs to.
The spec also defines a consistent set of operation names for agent-level steps: create_agent, invoke_agent, plan, invoke_workflow, execute_tool. That consistency is the whole point. Once every framework calls the same kind of step by the same name, a query written for one framework's traces works against another's, which is what standardization is supposed to buy you.
None of this costs anything worth worrying about. OpenTelemetry instrumentation adds under a millisecond of overhead, and it's swallowed entirely by LLM API latency, which itself is orders of magnitude larger depending on the call. Instrumentation costs almost nothing. Storage volume for all that telemetry is a real concern, and sampling strategy solves it rather than justifying skipping instrumentation from the start.
Auto-instrumentation coverage across major frameworks and coding assistants
None of this requires hand-rolling spans for every call an agent makes. Auto-instrumentation libraries already cover more than 40 AI frameworks, LangChain, LlamaIndex, CrewAI, and the OpenAI Agents SDK among them. The install surface is small: instrumentation packages for OpenAI, Anthropic, LangChain, LlamaIndex, and others. Call them once at startup, before any client gets created; every API call made afterward gets traced automatically without further code changes.
Coding assistants have started shipping this natively rather than waiting for a third-party wrapper. VS Code Copilot emits traces, metrics, and events for Copilot Chat agent sessions once enabled, configurable through github.copilot.chat.otel.enabled and github.copilot.chat.otel.otlpEndpoint. OpenAI Codex exports structured log events and OTel metrics covering API requests, tool calls, and sessions. Claude Code exports metrics and log events through OTel as well, with trace support in beta.
The backend side has caught up too. Major observability backends have begun mapping to the OTel GenAI semantic conventions. That's the payoff of standardization actually showing up in practice, not just in a spec document somewhere.
Tracing across agent handoffs in multi-agent systems
Multi-agent systems inherit every failure mode a single agent has, and then add one that's unique to having more than one agent in the loop: handoff failure, where Agent A passes incomplete or wrong context to Agent B, and Agent B keeps working from assumptions that were broken from the start.
Picture a summarization tool that receives a malformed context window at step three of a pipeline. A downstream sub-agent picks up that bad summary and hallucinates a citation that was never in the source material. Latency's fine, no error was thrown, and the whole chain returned a plausible-looking answer, so none of that failure appears in a monitoring dashboard. But laid out as a span tree, with each agent's inputs and outputs sitting side by side in the trace, the break is visible immediately: the malformed context at step three, and the hallucinated output that followed it downstream. That's the entire argument for treating agent observability as an execution graph rather than a set of health checks. A graph shows you causation. A dashboard only ever shows you a symptom, and sometimes it shows you nothing.
Sources
- AI Agent Observability - Evolving Standards and Best Practices
- OpenTelemetry for AI Systems: LLM and Agent Observability (2026)
- Inside the LLM Call: GenAI Observability with OpenTelemetry
- OpenTelemetry for AI Agents: Implementing Observability in MCP Workflows | MintMCP Blog
- What to Trace When Your AI Agent Hits Production
- OpenTelemetry GenAI Semantic Conventions Explained · Dash0
- OpenTelemetry's GenAI semantic conventions are NOT stable yet — here's what actually shipped in 2026
- GitHub - open-telemetry/semantic-conventions-genai